The List Statistics window shows you statistics about the currently selected list.
Open it by clicking the Statistics button from the List Window's toolbar.
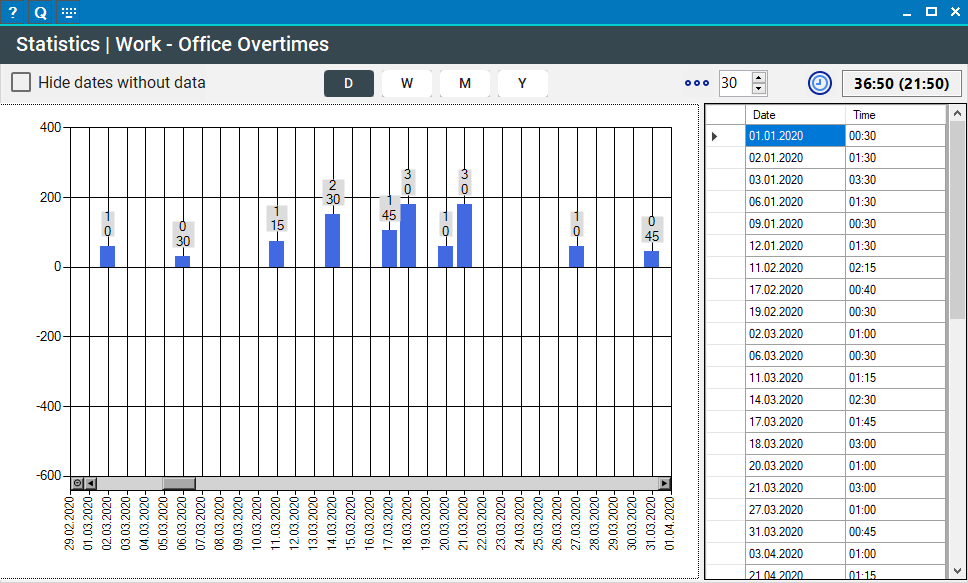
This window shows you the collection times/units from the current list neatly grouped to your liking.
Click any time in the list to the right to select the corresponding data point; and vice versa.
Hide dates without data
Check to hide dates that have no data points in the graph. If unchecked, empty dates/weeks, etc. will shown as empty sections like in the screenshot above.
Grouping: D(ay), W(eek), M(onth), Y(ear)
Click the respective button to change the grouping of the chart. You can group by day, week, month, or year.
Scale
Here you can choose how many data points will be visible without scrolling.
List Total
This area shows the list total, just like the respective field in the List Window.